How to measure AI coding tool ROI for engineering teams
Four signals measure AI coding tool ROI reliably: cycle time reduction, story-point velocity per FTE, deploy-to-fix latency, and code review time compression. Combined, they isolate whether AI tooling spend is producing engineering outcomes or just inflating activity dashboards.
Four signals measure AI coding tool ROI reliably: cycle time reduction, story-point velocity per FTE, deploy-to-fix latency, and code review time compression. Counting generated lines of code isn't one of them.
Combined, these four metrics isolate whether your AI tooling spend is producing engineering outcomes or just inflating activity dashboards.
Most engineering leaders already suspect their current measurement is wrong. The Stack Overflow 2025 Developer Survey found that while 84% of developers are already using or planning to use AI tools, trust in AI accuracy dropped from 40% to 29%, highlighting a growing gap between adoption and confidence in actual productivity gains.
Plenty of data already exists. The default metrics, lines of code and commits per developer, are exactly the ones AI tools inflate without improving shipped value.
What does AI coding tool ROI actually mean?
AI coding tool ROI is the measurable engineering value returned relative to the cost of tooling licences, onboarding time, and workflow disruption. For a CTO reporting to a board, this translates to a single question: did the tool make the team ship faster, or did it just make developers type faster?
The distinction matters because AI coding assistants make engineers faster at the input side of the job.
A Microsoft Research study on GitHub Copilot found that developers with Copilot access completed tasks 55.8% faster in a controlled experiment, a genuine speed gain. But finishing a task faster isn't the same as shipping a better outcome. The engineering outcome is whether that code reached production faster, with fewer defects, and at lower cost per feature.
Three categories define AI coding tool ROI
- Speed ROI: Did cycle time (commit to production) decrease? This is the primary delivery signal.
- Quality ROI: Did deploy-to-fix latency decrease, and did code review time compress without more defects slipping through? Both indicate the AI-generated code is not creating downstream rework.
- Capital ROI: Did velocity per FTE go up, lowering cost per story point? This is the financial metric finance teams need.
Without separating these three, a team can report "40% productivity increase" while shipping the same number of features at the same defect rate. That increase was activity. It wasn't value.
Why lines of code fails as an ROI signal
Lines of code (LoC) was always a weak productivity proxy. AI tools turned it into a misleading one. When an AI assistant generates boilerplate, test scaffolding, or repetitive logic, the LoC count climbs without a corresponding increase in shipped functionality. The metric rewards volume, and AI tools are volume machines.
When LoC per developer climbs from AI-generated boilerplate but deployment frequency stays flat, that gap is the tell: LoC tracks activity, and activity isn't delivery.
The deeper issue is attribution. Even if LoC did correlate with productivity, you cannot isolate whether the increase came from the AI tool, from a hiring wave, or from a simpler feature set that quarter. LoC is a noisy signal with too many confounding variables to be useful for ROI attribution.
What makes a metric resist gaming?
- Infrastructure measures it automatically, with no human estimate involved
- It correlates with a business outcome (revenue, retention, time-to-market)
- It cannot be inflated by generating more code without shipping more value
Cycle time meets all three criteria. LoC meets none.
The 4-signal framework for measuring AI coding tool ROI
Four metrics, used together, give CTOs a defensible ROI picture that separates genuine engineering gains from AI-inflated activity. No single metric is sufficient. The composite matters.
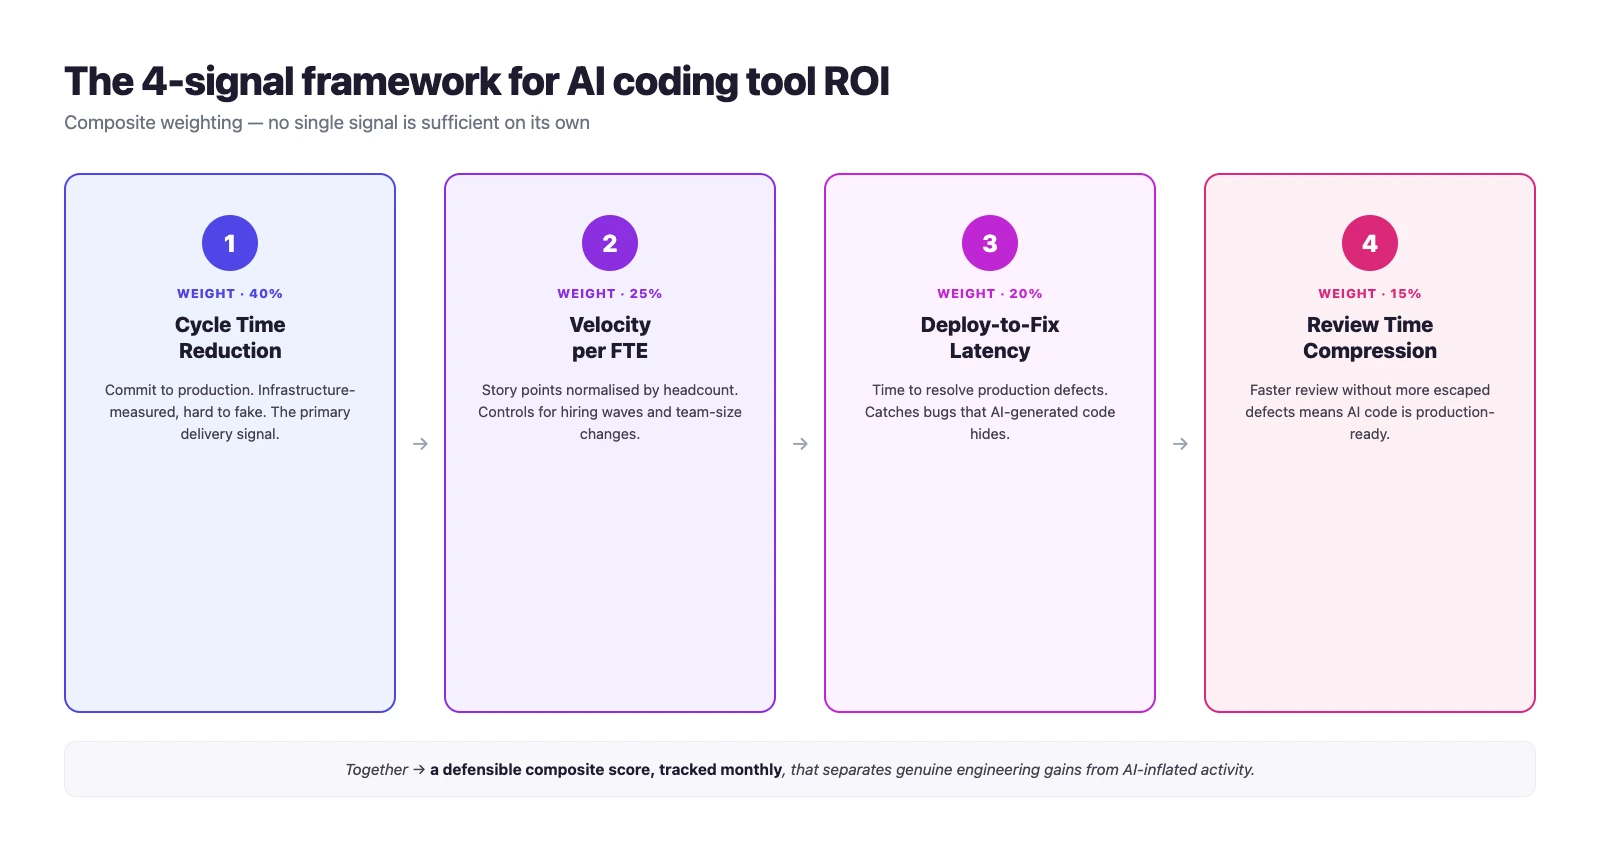
Signal 1: Cycle time reduction
Cycle time is the primary delivery signal. It is infrastructure-measured, hard to fake, and directly correlated with time-to-market. Industry benchmarks from the DORA 2024 Research Report classify elite teams at under one day and low performers at over one month.
Signal 2: Story-point velocity per FTE
Raw velocity belongs to sprint planning; on its own, it doesn't measure productivity. But velocity normalised by FTE (full-time equivalent headcount) controls for team size changes and shows whether each engineer is delivering more per sprint.
Signal 3: Deploy-to-fix latency
Deploy-to-fix latency measures how quickly the team resolves production defects. If AI-generated code creates an attribution gap where subtle bugs take longer to diagnose, this metric catches it. Track it alongside defect frequency. Latency can improve while defect count worsens, which reads as progress when it is actually a regression.
Signal 4: Code review time compression
If review time per PR decreases without a corresponding increase in escaped defects, the tool is generating reviewable, production-ready code. Research from GitClear shows that PR size and review method directly correlate with review speed and quality.
The composite calculation: Convert each signal to a percentage change from its own pre-adoption baseline, flipping the sign on cycle time, deploy-to-fix latency, and code review time, since a smaller value on each is an improvement. (Velocity per FTE is the only signal where the raw increase is already the improvement.) Then apply starting weights of cycle time 40%, velocity per FTE 25%, deploy-to-fix latency 20%, and code review time 15%. Treat this split as a reasonable default rather than a validated formula, and adjust it to match what your board actually weighs most. For example, a team with cycle time down 20%, velocity up 10%, deploy-to-fix latency down 15%, and review time down 5% scores (20 x 0.40) + (10 x 0.25) + (15 x 0.20) + (5 x 0.15) = 14.25. Track the composite monthly.
How do you isolate AI tool impact from other changes?
Attribution is the hardest part of AI tool ROI measurement. Engineering organisations change constantly.
The gold-standard approach uses regression analysis to control for confounding variables. The independent variables include AI tool adoption rate, team size, sprint length, and new-hire percentage. The coefficient on AI tool adoption gives you an adjusted association between the tool and the metric improvement. It doesn't prove causation, since selection effects and unobserved factors can still drive both.
For teams without statistical infrastructure, a simpler approach works:
- Identify a control group (team not using the AI tool) and a treatment group (team using it)
- Compare cycle time trends over the same period
- Account for obvious confounders (project complexity, seniority)
- Treat the delta as a directional signal that doesn't establish causation
The adoption curve problem: why good tools show negative ROI early
A common mistake is measuring ROI too early. In the first 30 to 60 days, engineers are learning the tool and adjusting workflows. Productivity often dips before it improves. Tool cost, meanwhile, starts immediately.
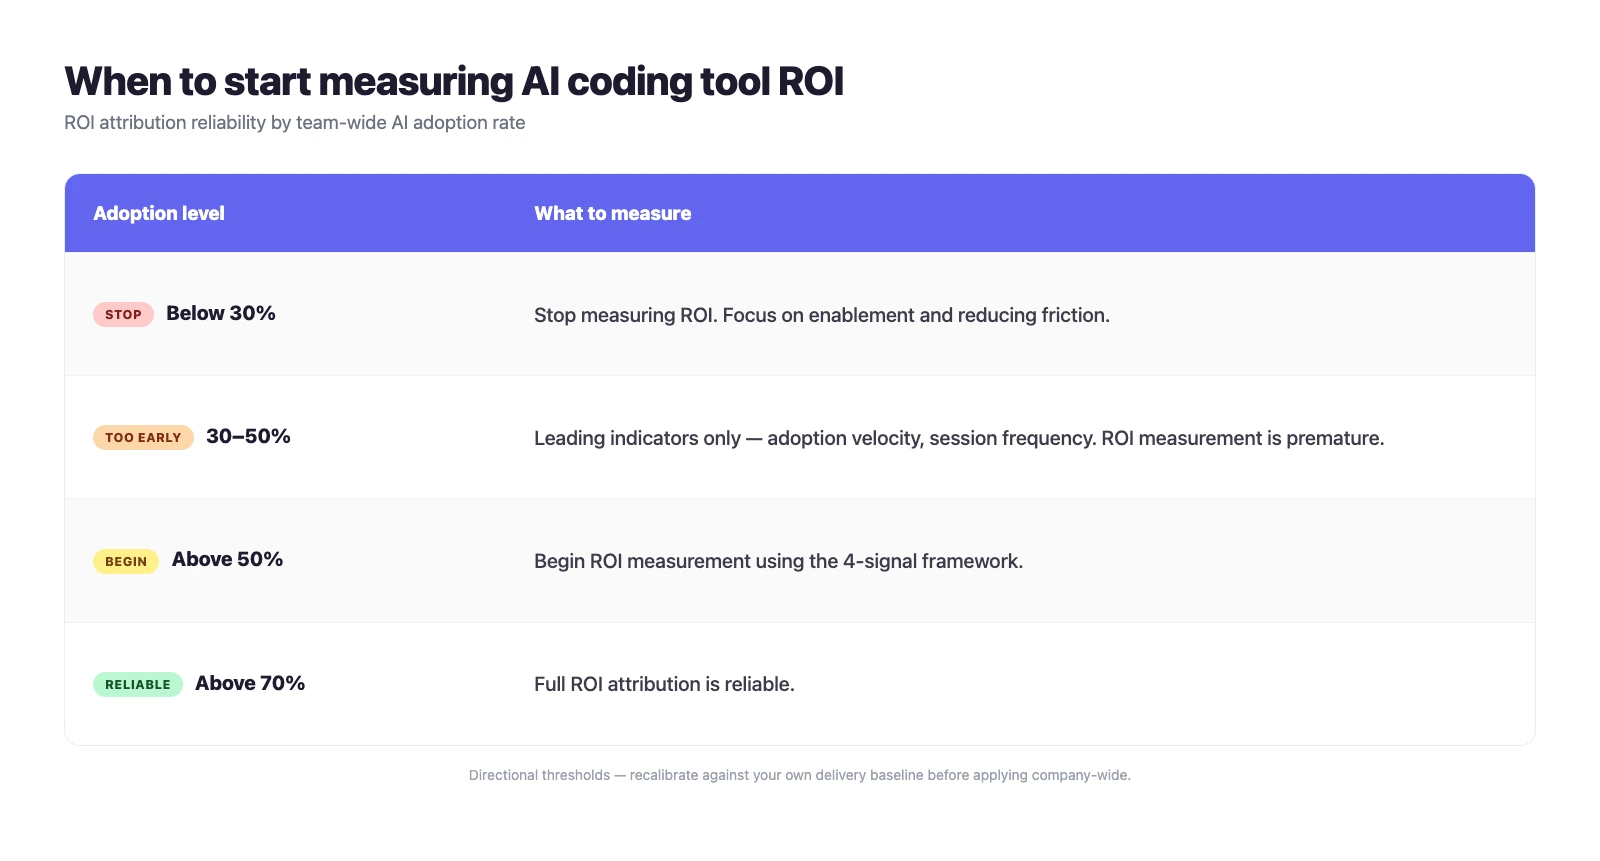
The adoption benchmarks that matter: treat these as a practical starting point rather than a published study result, and recalibrate them against your own team's ramp-up curve.
- Below 30% adoption: Stop measuring ROI. Focus on enablement and reducing friction.
- 30 to 50% adoption: Measure leading indicators only (adoption velocity, session frequency). ROI measurement is premature.
- Above 50% adoption: Begin ROI measurement using the 4-signal framework.
- Above 70% adoption: Full ROI attribution is reliable.
So, is your AI tool investment actually paying off?
Engineering leaders don't have a bad-tool problem. They have a measurement gap. Organisations that cannot attribute AI tool impact to delivery outcomes will either overspend on tools that are not working or cancel tools that are. The 4-signal framework gives CTOs a defensible answer when the board asks, "Is this investment paying off?"
Start with cycle time. If it is not dropping, your adoption rate matters more than your ROI calculation. And if your adoption rate is below 50%, the only metric worth tracking is how fast you are closing that gap.
Tetriz is building the attribution layer that connects AI tool adoption to engineering delivery outcomes. Join the early-access cohort to measure what your current dashboards cannot.